Back to Basics: Understanding the Data Analysis & Analytics Lifecycle
When we think about data and analytics the first thing that comes to mind is data, graphs, reports, and metrics. A more fundamental question is how do we get there? Analytics just doesn’t happen. There are clearly defined steps that need to occur as we embark on our analytics journey. Let’s look at how data and analytics drives informed decision making. We will do this by looking at the analytics process to understand how to get the most of data and analytics.
Data Analysis: The first thing to understand is that data analysis and analytics is driven by a well-defined lifecycle. The steps in that lifecycle lead to the development of a solution that is in alignment with business outcomes. The CRISP-DM® process is an industry-accepted approach for data analysis and data mining. Don’t be put off by the term data mining, it simply means the extraction of usable data from a larger set of data for the purpose of analysis. Now, back to the CRISP-DM process.
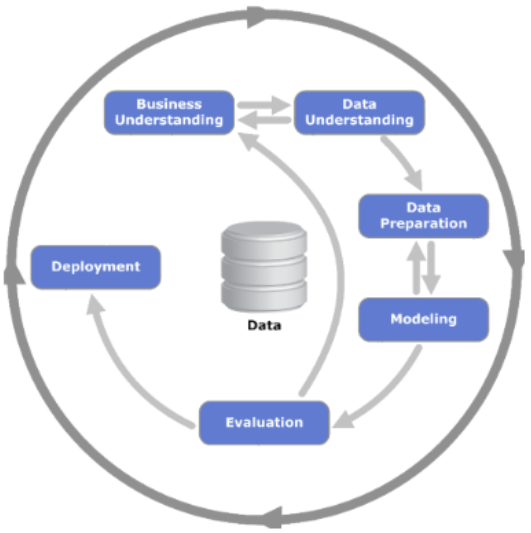
Let’s delve into the process and understand the implication of the steps:
Business Understanding: Business understanding and the desired business outcomes define the data requirements from sourcing, quality, relevance and timeliness perspectives. The level of business understanding defines the likelihood of success or failure for a data analysis initiative.
Data Understanding: This is where the characteristics are uncovered. Questions answered at this stage are:
- Is there data available to support my business outcome? There are many instances where the data supporting the business outcome is just not available or it is available but is not being collected.
- What data quality issues exist? There may be plenty of data available but, the quality of the data is suspect. There can be missing data, outliers or just simply wrong data. Data profiling should be used to understand ranges of acceptable values, what data is missing or the reasonability of the data. This also includes relevance and timeliness. Relevancy is easy to understand. With regards to timeliness, what good is data if it is not current enough to drive decision making in today’s dynamic business environment.
Note that the reciprocal relationship between “Business Understanding” and “Data Understanding.” As business needs change so may the required data; conversely, the available data may provide a deeper business understanding.
Data Preparation: Data preparation can be the most underestimated and overlooked process step. Approximately 75% of data analysis can be tied to data collection and preparation. Not surprisingly, a large portion of this time is tied to the resolution of data quality issues. The remainder of the time is used to prepare data for further analysis. It should be noted that the same data may be prepared in different ways depending upon its usage.
Data quality is one of the most significant issues that lead to bad decision making and extremely detrimental to an organization. This raises the question of how much effort is required to develop and deploy and data quality remediation strategy. Addressing major data quality issues should be of primary importance and any decisions related to data quality remediation or data transformation should be documented to maintain a record of data lineage.
Modeling: Whether it is a financial model, statistical or machine learning model, all the hard work begins to come to fruition in this step. The key point is to choose some model(s) appropriate for the type, quantity, and nature of the data. If multiple models are used, their overall performance must be evaluated to determine the most suitable model.
There is a reciprocal relationship between the Data “Preparation” steps and “Modeling.” This means that the data preparation step may be revisited to support changing model requirements.
Evaluation: Now that all the modeling is completed, it is time for model evaluation. Each model is evaluated to determine how well it meets overall “Business Understanding” and the associated business outcomes. The model evaluation will drive “Business Understanding” which will, in turn, drive the “Data Understanding,” “Data Preparation” and “Modeling” steps.
Data visualization should also be included in the evaluation step. Visualizing the results of the modeling step provides makes it easier to evaluate the overall performance of the model and may. It also may uncover previously unknown insights.
Deployment: The final step is deployment. This is where the results are shared with business partners for review and comment. During the deployment phase, consideration needs to be given to:
Review of the final analytics solution to determine how well it matched expected business outcomes:
- How will the analytics solution be introduced to the organization?
- How will the analytics solution be maintained and monitored?
- What documentation will be produced to support the analytics?
Summary: The data mining and analytics lifecycle (CRISP®) is a framework for successful data analysis and deployment of analytic solutions. Some may view this process as time-consuming, however; without a well-defined approach, much more time can be wasted trying to figure out how to get started and how to proceed with the development and deployment of a data mining/analytics solution.